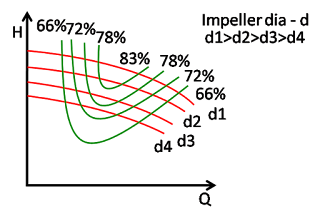
What is Iso efficiency curve? Performance curve with different impeller diameters are plotted against the co-ordinates (x and y). Q-H curves are plotted for each impeller dia. after taking actual running test. (similarly Q-n curve is plotted). The next step is to draw parallel lines to x-axis intersecting the Q-n curve. It is necessary to select points on each Q-n curve for the same values and project upwards from these points to intersect Q-H curves. Marking and joining these lines makes what is known as Iso Efficiency Curves.
This curve serves very well for indicating efficiency zones at a glance. When new pump is to be selected, this graph comes very handy as we get to know the various impeller diameter performance. we can select proper impeller dia considering future demand/ reduction in demand. If we have iso eff curve of diff model pumps, we can easily figure out which model to select depending on our present and future demand.


