Ad

Saturday, November 12, 2016

Characteristic Curve Combined curves

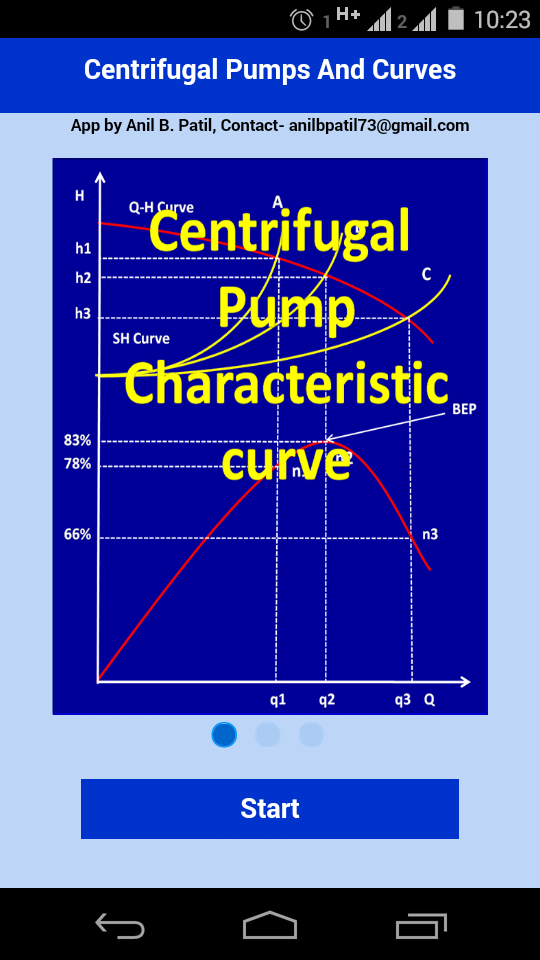
This is the combined curve. That means, it has a combination of curves that we have studied so far. Note:- in this curve, I have not added NPSH curve as it was not practical to put it from visibility and clarity of the graph.

Most of the time, manufacturer will be providing this graph. Here we can see different parameters such as power, flow, head and efficiency in one single graph.
It is very important to learn this graph as most of the problems on field related to pump and pumping system can be solved by studying this graph along with the data taken on site.
This graph also helps to explore the possibility of energy conservation. This is an excellent tool to understand and implement energy saving measures. In this version, we will not be focusing on this topic, but just for reader to understand I am giving following example.
Suppose we have an old system which was designed during project stage.The system has a single pump pumping water to an overhead tank at the rate of 200 cu. m/hr. And as a safety, the o/h tank was allowed to overflow at the rate of 20 cu.m/hr back to the supplying tank. Initially, this pump must have been selected to operate near BEP (Best Efficiency Point). Along the years, due to system improvement, head was reduced (one heat exchanger is removed which reduced the frictional head, this will shift operating point further right of BEP).Due to this, 10cu.m/hr more water is pumped to o/h tank. This means now o/h tank is overflowing 30cu.m/hr of water. Now if the system runs as it is, operating point has shifted to right side of BEP. This means efficiency will be reduced. If we throttle discharge valve, we can bring back the operating point back to BEP. At BEP, eff was 75% and pump was operating to right of BEP at 66% eff, so by throttling, we can save 9% of energy (only from efficiency). Actually, power savings will be more as duty point has shifted towards left, where power consumption has also reduced.

Sunday, September 18, 2016

Characteristic Curve NPSH curves

NPSH Curves(Fig-1) shows both, NPSHa and NPSHr. NPSH stands for Net Positive Suction Head. Now what is this?. Pl refer NPSH chapter for details.

Now, Please refer this graphs just for illustration. Here Y axis is not to scale. Means, you can consider two graph overlapped on one just to show the diff. As the flow from the pump increases, NPSH required by the pump keeps on increasing. At the same time, NPSH available in the system keeps on decreasing. When the flow is q1, NPSH available is na1 at point A which is more then na2 at point B where flow q2>q1. Similarly, NPSH required at point B is more then NPSH required at point A.
Curve-2  This graph shows NPSH available and NPSH required in same graph in with Y axis showing head in meters. As flow increases, the margin between NPAHa and NPSHr reduces. The point A, at which flow is q, the margin is known as Safe pressure margin at impeller eye over liquid VP. The safe margin goes on reducing from point A to point B(where it is zero). For proper functioning of the pump, NPSHa must be always more then NPSHr by at least 0.5m.Note:- For every pump, a particular force (Head) in terms of mlc is required for every speed and flow rate to prevent the liquid from vaporization.

Friday, September 2, 2016

Characteristic Curve Q-Efficiency Curve

This curve is Q-Efficiency Curve. Note that this curve increases to the highest point and then drops to certain level and stops.
As we move from point A to B then to C, we can see that efficiency increases to max at point B (this is known as Best Efficiency Point) and then drops. At point A, Efficiency corresponding to q1 is n2 which is less then at point B, where flow q2>q1 but efficiency n1>n2. Also note that efficiency corresponding to point B is maximum. There after, if flow increases, efficiency starts dropping. At point C, flow q3>q2 and efficiency n1>n2. Also we can see that point A and C have same efficiency. Will discuss more about this in later posts.

Sunday, August 14, 2016

Characteristic Curves Q-p Curve

Power consumed by the pump is plotted against different flow rate, the curve is know as Q-p Curve. Power gradually increases as we move towards right side (Note:- This phenomenon is only with centrifugal pumps). This means that as we open discharge valve, flow increases and so does the Power. This continues up to certain point and after that, there is a sudden drop of flow and power. This is not shown in following graph but same will be dealt within other topic. This point is known as cutoff point.
q-p cuve

Please note that at point A, flow is q1 and power consumed by the pump is p1. And at point B, flow is q2 and power is p2. At point B, flow q2>q1 and p2>p1.

Sunday, August 7, 2016

Characteristic Curve Q-H Curve

This curve is known as Q-H Curve. When the discharge valve is fully closed, head developed by the pump is maximum. At this point, discharge is zero. This head is known as Shutoff Head. As we slowly open discharge valve, flow starts and flow increasea whereas head developed by the pump decreases. We can see on graph that at point A, flow q1 corresponds to head h1. And at point B, flow q2 corresponds to head h2. We can see that q2>q1 and h1>h2.

On field, if we want to know the head developed by the pump, place a pressure gauge just above pump discharge or at discharge flange (if tapping is provided). We can then take the reading of pressure gauge and convert it to head. Remember the conversion from pressure to head and vice versa?. Sp.gr. is very important. Hence if any doubt is there, pl refer to Head section of this app.

Sunday, July 31, 2016

Cavitation

What is CAVITATION


Fig-1 (pic of impeller having cavitation effect). If the pressure at any point inside the pump drops below VP of the liquid, then under such condition the liquid can 'Flash'(boiling). i.e. changing from liquid to gaseous phase. The vapor bubbles or cavities are carried along with the stream through the impeller eye to regions where the pressure within the impeller shroud rises due to centrifugal force. In the higher pressure zone the bubbles collapse or implode with tremendous shock and noise. This phenomenon is called CAVITATION. Ref Fig-2


Why it happens
The absolute pressure at the pump suction nozzle and cavitation problems are closely linked. If the lift is high and pump operates beyond BEP, then suction velocity increases to such an extent that it causes further drop in suction pressure. when the pumps runs under such conditions then the risk of liquid getting vaporised cannot be ruled out. However, for cavitation to occur, the pump need not necessarily work beyond BEP towards the right hand side of curve. It will also happen if the pump is working far beyond left of BEP. Also, cavitation can happen at any point on the curve if NPSHA is less then NPSHR.
There is limit to which abs pressure in the suction pipe can be reduced. Centrifugal pump with ordinary design does not function properly when the liquid contains vapors.
How to prevent Cavitation
Pump must be selected to operate at BEP. This is most important factor. If there is variation at site, necessary arrangement, if possible is to be done to make pump operate at BEP.
To provide enough head on the pump suction side (say by reducing the suction lift by taking pump near the suction source) so that the suction pressure at the impeller eye will remain above the liquid VP.
We can also reduct the discharge to bare minimum and thus reducing the NPSHR. This can be done by installing pulley drive system.
Where and why it forms
Impeller eye forms the zone of lowest suction pressure because:-
Ref Fig-3

1) Rotating impeller causes forced vortex formation just in front of impeller eye causing pressure to drop.
2) Further pressure drop takes place because of abrupt change in flow direction and sudden increase in velocity due to centrifugal force.
3) Rotating vanes causes shock to flow and increases friction resulting in further drop.
This is why impeller eye zone after the inlet vane tip portion is prone to severe action of cavitation. Proper filing of vane inlet tip and finishing of the eye area may reduce gravitation to some degree.
Cavitation and liquid properties
1) Specific Gravity
If the sp.gr. of liquid increases, the danger of cavitation also increases as to that extent the available NPSH is reduced.
2) Liquid Temperature
Liquids have the ability to dissolve gases or air in varying quantities. The amount of gas/air which goes in to the solution depends on liquid temperature and pressure on its free surface. The volume of gas/air absorbed by the liquid decreases as temperature rises. However, dissolved gases are released from the liquid when the pressure decreases.

Wednesday, July 27, 2016

What is difference between Static Head And Static Lift

What is difference between Static Head And Static Lift. When in a pumping system, the source of liquid is below pump datum, head is defined as Static Suction Lift. It is the distance between pump datum and the liquid surface. This attracts -ve sign. Example- Pump operating to lift water from well and pump it to overhead tank. In this example, water is drawn from below the pump datum. Fig-1.
When in a pumping system, the source of liquid is above pump datum, head is defined as Static Suction Head. It is the distance between pump datum and the liquid surface. It is also called Flooded Suction. Example- pump operating to transfer water from ground level tank to overhead tank. Ref Fig-2


Sunday, July 17, 2016

Term Pressure

Atmospheric Pressure


Fig-1 Atmospheric pressure balances a column of mercury(Hg) to the height of 760 mm at sea level or water column of 10.33 m. The atmospheric pressure at sea level is 1.033 kg/cm2 at normal temperature (15.550C or 600F).
Figure shows a vessel filled with mercury exposed to atmospheric pressure. A capillary is placed in the center of the vessel. Due to the atm pr, the liquid, i.e. Mercury, rises up to 760mm.
The atm. pr. drops at the rate of about 1 meter for every 1000 meters increase in altitude, above mean sea level.

The Physical Atmosphere (Atm.)

It measures 1.033kg/cm2 = 760 mm of Hg (at sea level). This should not be confused with the Technical Atmosphere of 1kg/cm2. The standard atmospheric is 1.013 bar or 760 mm of Hg column.

The Technical Atmosphere (Atm.)

The unit of 1 atm = 1kg/cm2 = 735.5 mm of Hg is called the technical atmosphere.

The Concept of Vacuum


Refer Fig-2 (click here) Theoretically zero atm. pr. would be attained in a perfect vacuum. This is known as Absolute ZERO pr. All practical pr. are then made either relative to this datum or to the atm. pr. Pl refer the figure above

Vapor Pressure (VP)


Ref Fig-3 (click here) Substance/ Matter exists in three phases: 1) Solid, 2) Liquid and 3) Gas.
The term vapor pressure is frequently used in connection with centrifugal pumps, Particularly in Thermal plants and Process Industries.
All liquids have a tendency to evaporate when exposed to atm. The rate at which this evaporation occurs depends on the molecular energy of the liquid.(i.e. type of liquid and its temp.) and the condition of pr. adjoining the liquid surface.
Ref. fig above Consider a liquid contained in a sealed in beaker A. Assuming the constant temp is maintained, some of liquid molecules have sufficient energy to break away from the liquid and enter the air in the vapor form as in A. As the time passes, the air will contain vapor molecules to the extent that some of them will be forced to re-enter the liquid by the partial air pressure as shown in B. Eventually equilibrium will be attained when the rate at which molecules break away from liquid, same will re-enter back in to the liquid. As shown in C. Under such condition, the air above the liquid is saturated with liquid molecule and the pr. on the liquid surface is called its vapor pressure at prevailing temp.
Under vacuum, the pressure of vaporisation is accelerated. The boiling point of liquid has direct relation with the pressure above its surface. At higher pr. the boiling point increases and vice versa.
When a liquid has a very high vapor pr. is evaporates readily even at room temp. It is called a "Volatile Liquid" (like Petrol).
V.P. has great effects on working of centrifugal pumps. The energy available at the eye of the impeller gets reduced as liquid vapor pr. increases. In section of NPSH, will study further.

Tuesday, July 5, 2016

What is NPSH ?

Net Positive Suction Head(NPSH)

A liquid can not be sucked inside the pump. Liquid has to be pushed inside the suction pipe Fig-1. For a liquid to be pushed into a suction pipe some external energy, force or head is required. Atm. pr. provides this head on the free surface of liquid from which the pump draws the liquid.


Theoretically, at sea level the maximum suction lift is 10 m (for water). Actually because of effects of several factors, it is less than this value. Pipeline friction, liquid VP are some of the constraints that determine maximum allowable suction lift.

So what is NPSH?

In Net Positive Suction Head (NPSH)

Net stands for remaining Positive stands for greater then ZERO (pressure) Suction head stands for abs. energy at the pump suction flange in meters of liquid above VP at pumping temperature (in relation to Zero abs. Pr.)
Ref Fig-2 to understand- 


CASE - 1 With zero suc. lift, NPSH is 10m (10-0).

CASE - 2 With 3m suction lift, NPSH is 7m (10-3).

CASE - 3 With 5 m suction head, NPSH is 15m (10+5).

We have ignored other factors like hf losses and VP of liquid involves for simplicity

NPSH Available

It can be defined as the absolute energy in mlc available at pump inlet nozzle and corrected to pump datum minus VP of liquid.

Factors to be considered for NPSH.

1) Atmospheric pr at pumping site converted in mlc.

2) Abs VP of liquid at pumping temp. in mlc.
3) Friction losses in suction pipe in mlc.
4) Suction lift or head in mlc.
5) Pressure head in closed suction vessel in mlc.
This is the characteristic of the system in which the pump operates (site condition). The NPSHA value is to be given to the manufacturer by us when we want to buy the pump.

NPSH Required

This is required or minimum NPSH of the pump (NPSHR)

It can be defined as the positive head in meters abs. necessary at the impeller eye to overcome the internal pressure drop within the impeller and maintain the liquid pressure above its VP and thus ensure stable flow in to the impeller. The pump designer decides the NPSHR value of the pump model.

NPSHR is the function of the impeller eye peripheral velocity in m/s and suction velocity of liquid at pump inlet in m/s. It logically follows that for the same pump when run at 1500 rpm requires less NPSHR then the pump with same discharge and head running at 2900 rpm.

NPSHA must be always more then NPSHR by at least 0.5m.

CAVITATION can occur at any point if NPSHA is less then NPSHR.  

Wednesday, June 22, 2016

Centrifugal pump - why term Head ?

What is Head?
The word Head is frequently spoken in the field of water working, pumping etc.
A column of water or any liquid in a vertical pipe exerts a certain pressure (force per unit area) on a horizontal surface at the bottom, this pressure is expressed in kg/cm2 or meters of liquid column (mlc). The height of a liquid column is known as HEAD.

Please refer the FIG 1 to understand the concept. A square container with 1m x 1m bottom and 10m height will exert a pressure of 1kg/cm2.
This means that any shaped container with water filled up to 10m height will exert a pressure of 1kg/cm2 and can be seen at pressure gauge attached at the bottom of the container.


Head and Pressure
The relation between Head in meters of liquid column and pressure in kg/cm2 can be expressed as under:-
H in mlc =(P x 10)/ r.
Where P = Pressure in Kg/cm2.
r = sp. gr. of liquid.
(1 kg/cm2 = 10 m of water column)

Why is head always measured in mlc?
Please refer FIG 2 to understand it. A centrifugal pump with a given speed in rpm and impeller dia will drive any liquid to the same height (Head)irrespective of its sp. gr. Please note:- Pressure gauge readings will vary according to sp.gr.
Figure is self explanatory, all the liquid having same height of column of 10 m, will have diff pressure based on sp.gr.


Monday, June 13, 2016

App for centrifugal pumps.

Hi,
I have made an app to understand centrifugal pump basics and charisteristic curves.
This app is free of cost and available at Google play store free of cost with the name "pump curves".
Please share as much as possible as it's free and very helpful for the engineers.